


Beyond the Numbers: A Week That Challenged xG Logic
How football’s most trusted metric reveals truths over time, not always in 90 minutes

When Arsene Wenger spoke about Manchester City after Arsenal’s 3-1 loss in November 2017, he caused quite a stir in football analytics circles, particularly as Opta had only announced expected goals (xG) as an official metric just a few months earlier, in August 2017. Reflecting on the match, Wenger said: "If you look at the expected goals, it was 0.7 for them and 0.6 for us, it was a very tight game. They created very little... Overall, I think we were hugely punished."
At the time, this was a groundbreaking statement. Wenger was among the first high-profile managers to acknowledge xG as a valuable metric for analysing performance beyond the final scoreline. His comments highlighted how the story of a match could diverge from the raw numbers on the scoreboard, a sentiment that rings particularly relevant after this week of football.
Since then, the football landscape has transformed dramatically. Data-centric approaches have taken centre stage, with analytical teams becoming integral to almost every club’s operation. xG has evolved from a niche concept to a cornerstone of football analysis, driving insights into player scouting, tactical decisions, and post-match evaluations.
Moreover, various derivatives of xG have emerged, each tailored to capture nuanced aspects of the game. Metrics like xG on Target (xGoT), post-shot xG (PSxG), and On-Ball Value (OBV) are now part of the modern analyst’s toolkit. These refinements reflect the growing sophistication of football analytics and its ability to shed light on the game’s hidden patterns.
xG has also become a cultural benchmark in sports media, referenced widely across platforms to frame discussions on performance. To underscore Wenger’s forward-thinking perspective, the chart below illustrates the rise of xG’s prominence over time in Google Trends. It’s a testament to how far the metric has come―and a reminder that, while powerful, xG should be interpreted with its context and limitations in mind.

Figure 1. Comparative Google Trends Analysis of the Popularity of 'Expected Goals' and 'xG' Over Time (2016–2024).
A Curious Week for Expected Goals
This past week in football was one for the analytics enthusiasts. Teams with sky-high xG numbers struggled to convert chances, while others punched above their weight, scoring well beyond their expected metrics. From FA Cup clashes to La Liga and Ligue 1 surprises, the xG paradox was on full display.

Figure 2. xG Discrepancies in Big 5 League Matches (10–12 January 2025) Highlighting Controversial Results Based on Expected Goals.
The gap between xG and actual outcomes in this week's matches can largely be attributed to extraordinary individual performances and critical moments that defied expectations. At North London, Manchester United's second-choice goalkeeper Altay Bayindir was pivotal in their progression, saving a penalty during regular time while Man.United played with ten men and another during the shoot-out. Similarly, Rayo Vallecano's goalkeeper Daniel Cardenas recorded a stunning 86% save ratio, stifling Celta Vigo’s attack despite their higher xG. Meanwhile, Como’s poor finishing, with just 18% of their shots on target, kept Lazio in the game, despite the latter struggling to generate xG after being reduced to ten men. For Bayern Munich, multiple players achieved over 0.5 xG, but only Harry Kane managed to score, converting a penalty against Gladbach’s goalkeeper Moritz Nicolas, who had a flawless save ratio aside from the spot kick. These moments of penalty drama, goalkeeper heroics, and suboptimal finishing provide a compelling narrative behind the xG anomalies this week.
These anomalies remind us of an essential truth: xG is not a crystal ball for single matches but a powerful lens to view performance trends over time. One week, a team might struggle despite dominating on xG, but over a season, these metrics tend to balance out, painting a fairer picture of consistency and quality. Below is a graph illustrating the Goals - xG margins for the five champion and relegated teams of Europe’s big five leagues from the 2023-2024 season. This visualisation highlights how positive margins align with long-term success, while negative margins reflect struggles over the course of the season.

Figure 3. Goal vs. xG Differences for Champions and Relegated Teams in Big 5 Leagues (2023–2024).
Wenger's Wisdom and xG's Evolution
Wenger’s post-match remarks in 2017 may have seemed ahead of their time, but they’ve since become a foundation for how managers, analysts, and fans think about football. His ability to look past the scoreline and delve into deeper insights aligns with the principles of modern football analytics.
Today, xG isn’t just a buzzword but a cornerstone of understanding team performance. It helps uncover strengths and weaknesses that might otherwise go unnoticed, offering a perspective that goes far beyond who scored and when.
It’s safe to say that Erik ten Hag's era at Manchester United stands as one of the least successful periods in the club’s illustrious history, and this assertion finds strong support in various statistics. During the Ten Hag period, the big six teams excluding Manchester United accommodated 20+ xGD, while United recorded negative values. These numbers tell a fascinating story. Though xG is an invaluable tool for analysing football performance, is it able to ever tell the whole story? In United’s case, it highlights a broader struggle, but as with any metric, it raises the question: how far can xG alone go in explaining a team’s trajectory?
Beyond xG – Adjustments Matter
While xG provides a strong baseline for assessing attacking quality, it doesn’t operate in isolation. In two of Deadball’s Karakus’ published studies, they explored how positional adjustments and player-specific tendencies impact xG models, providing a more nuanced view of the game. These adjustments can refine how to interpret xG in specific contexts, such as understanding why certain players consistently outperform or underperform their expected metrics. Such insights are crucial for making sense of those "off" weeks where teams seem to defy the xG odds.

Figure 4. Distributions of xG adjustments for Bayes-xG3, where adjustment is hierarchical model prediction minus baseline model prediction - grouped by player. Mean xG for each player shown as “o” in boxplots.
The Figure above is from the Bayes-xG paper of Scholtes and Karakus and highlights the importance of these adjustments, showcasing individual player tendencies in xG deviations. Robert Pires (The Invincibles Season) stands out with significant positive adjustments, some as high as 0.3 above the baseline, reflecting his ability to consistently convert challenging opportunities. This trend persists even when accounting for additional factors, underscoring his exceptional finishing skills. Meanwhile, players like Agüero display smaller but consistently positive adjustments, while others, such as Vardy and Coutinho, show minimal deviations. These patterns highlight the diverse ways players handle goal-scoring chances, from straightforward finishes to difficult shots requiring elite precision.
These refinements are not just theoretical; they are tools for interpreting performance anomalies in real-world contexts, whether it’s evaluating a striker’s form, scouting talent, or analyzing tactical success. By considering adjustments, analysts and teams alike can deepen their understanding of how the game unfolds at both the player and team levels.
A Statistical Perspective on the Week’s Upsets
Statistically speaking, the results this week might feel like outliers, but they serve as a reminder of football’s unpredictable beauty. While xG adjustments offer a deeper understanding of player and team tendencies, variance remains a natural part of any sport. As an example, Manchester United’s narrow win this week, despite a negative xG difference, reflects both Altay Bayindir’s penalty heroics and the moments of brilliance that defy statistical expectations.
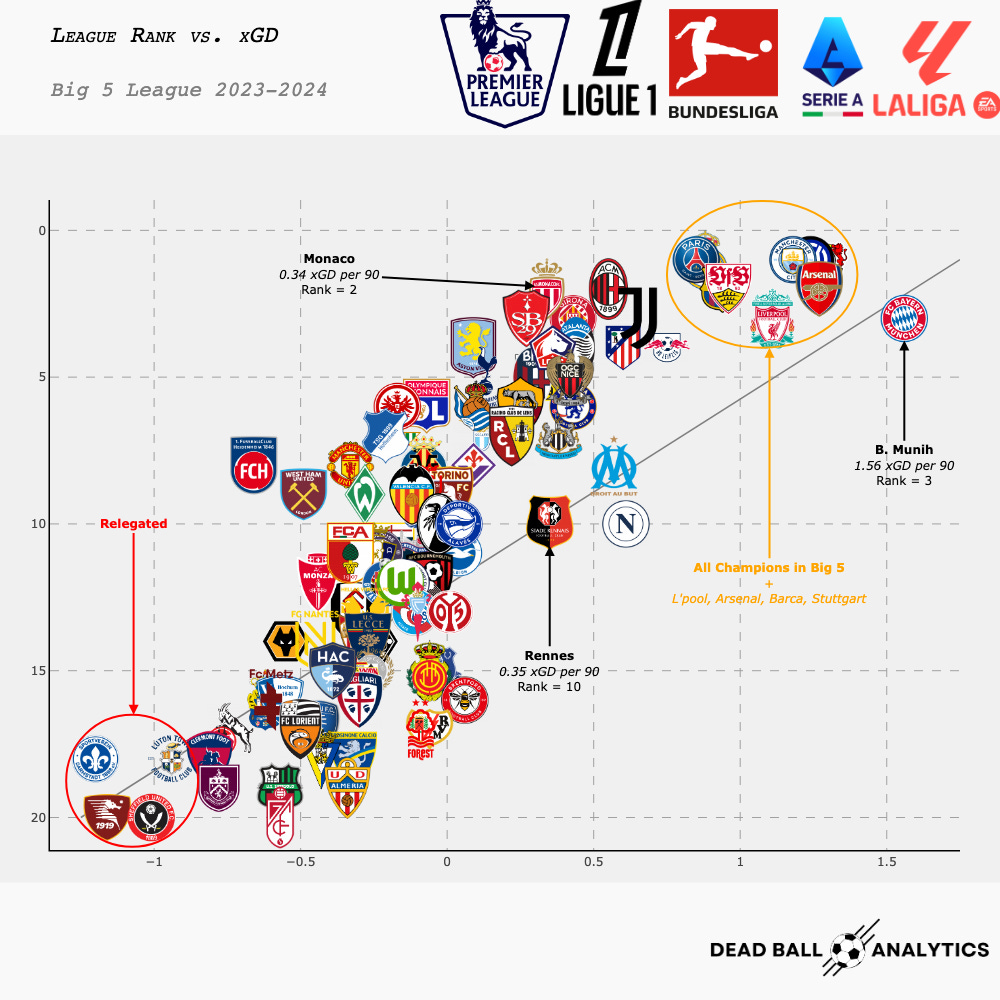
Figure 5. League Rank vs xG Differences in Big 5 Leagues (2023–2024).
The accompanying graph vividly illustrates this duality, which compares xG differences (xGD) to league rankings across major European leagues. Notably, Bayern Munich stands out as an outlier, boasting the highest xGD per 90 minutes (1.56) yet finishing third in the Bundesliga―a rare disconnect between statistical dominance and league outcomes. Conversely, a cluster of champions from the Big Five leagues along with Liverpool, Barcelona, Arsenal, and Stuttgart occupy the high xGD and top-ranking quadrant, reinforcing the general trend that strong xG metrics align with success over a season.
The graph also highlights the struggles of relegated teams, which tend to cluster in the bottom-left corner with the lowest xGD and league ranks. However, anomalies like Monaco and Stade Rennais in Ligue 1―finishing second and tenth, respectively, despite nearly identical xGD values (0.34 vs. 0.35) underscore the role of context, chance, and individual match outcomes in shaping a season.
Football is unique in that it blends the measurable with the immeasurable. Metrics like xG provide insight into performance, but moments of unpredictability like a world-class save or a last-minute goal keep fans hooked. These anomalies remind us that even the best models can’t predict every twist. While xG deepens our understanding, it’s the unexpected moments that define football’s magic.
Why We Love xG, Despite Its Imperfections
This is the paradox that makes the game so captivating: even with all our data and analysis, the game remains unpredictable. If xG perfectly aligned with match outcomes, would the sport retain its magic?
Take, for example, Leicester City's fairytale 2015-16 Premier League title run. With an average xGD per game that lagged behind many of their rivals (0.53 whilst Arsenal:0.83, Spurs:0.71, and Man City:0.67), they defied expectations week after week. Who could forget Wes Morgan's scrappy headers or Jamie Vardy's stunning 30-yard strikes that seemed statistically improbable but landed Leicester atop the league? Their triumph wasn't just a statistical rarity, but was a story of grit, belief, and seizing the moment.
Similarly, iconic moments like Alisson Becker's incredible last-minute header for Liverpool against West Brom in 2021 remind us why we love the game. The xG of a goalkeeper scoring from a set piece? Almost non-existent. Yet it happened, etched forever in football history. These moments remind us that xG is a tool, not a script. It sharpens our understanding of the game but leaves room for surprises that keep us on the edge of our seats. Football's beauty lies in its unpredictability, where the unexpected creates legends and keeps fans dreaming.
Life, Like Football, Is Just xG and a Whole Lot of Chaos
To lighten the mood, imagine if life had its own xG model. Your morning coffee has an xG of 0.95 – practically a tap-in – but somehow, you spill it. Or you’re sprinting for the last train home with an xG of 0.2, and miraculously, you make it. This is variance in action, not just in football but in everyday life.
Football mirrors this unpredictability in the best way possible. As Adam Fawer puts it in Improbable: "So what's my point? It's not that we are all going to be killed by an asteroid. Instead, I want you to understand about low-probability events, and that is this: Shit happens!"
These low-probability moments are precisely why we love football. Think about Nicklas Bendtner scoring from an angle with an xG close to zero, or Leicester City defying their xG odds week after week to win the Premier League in one of the most remarkable stories in modern football history. These are the moments that remind us that xG, while insightful, isn’t destiny and it’s just part of the story.
Variance is what keeps us coming back. It’s the reason we marvel at a goalkeeper pulling off a triple save in a penalty situation or cheer when a struggling team finds their form against all odds. Whether it’s the beautiful unpredictability of football or the chaos of life, variance keeps us guessing, hoping, and celebrating.
Perhaps life itself is the ultimate xG model. A perfectly brewed coffee, a perfectly executed free kick both might seem like guarantees. But sometimes, the coffee spills, the shot sails over the bar, and we’re left shaking our heads and laughing. As the saying goes: "Shit happens."
So, xG explains the game, but it’s the miracles, mishaps, and magic that make football and life worth it.
Wrapping Up: Embracing the beauty of football's variety
As we wrap up this week’s football analysis, we return to the wisdom of Arsène Wenger: “Football is unpredictable, but statistics give us a tool to better understand its beauty.” xG is just that a tool. It helps us unravel the intricacies of the game, spotlighting patterns and tendencies while leaving room for the magic of the unexpected. It’s not an infallible oracle but a guide that deepens our appreciation for football’s blend of skill, strategy, and serendipity.
This week reminded us of the sport’s essence: variance is inevitable, humanity is at its core, and beauty lies in its unpredictability. From Altay Bayindir’s penalty heroics to low-xG wonder goals, football’s narrative refuses to be fully captured by numbers alone.
To bring it all together, check out the infographic (Figure:2) summarizing this week’s xG highlights. From key outliers to standout performances, it’s your snapshot of how the numbers told a story but not the whole story.
Key Takeaways:
Big Picture: xG aligns with performance trends over time but often leaves room for surprises.
This Week’s Insights: Unexpected outcomes remind us of football’s drama and unpredictability.
Player Focus: Individual brilliance often defies statistical expectations.
We’d love to hear from you! Share your favourite xG-defying moments from this week or your all-time favourites in the comments or on social media. Let’s celebrate the magic of football the goals, the saves, and the moments that no model could ever predict.
Happy weekend!